
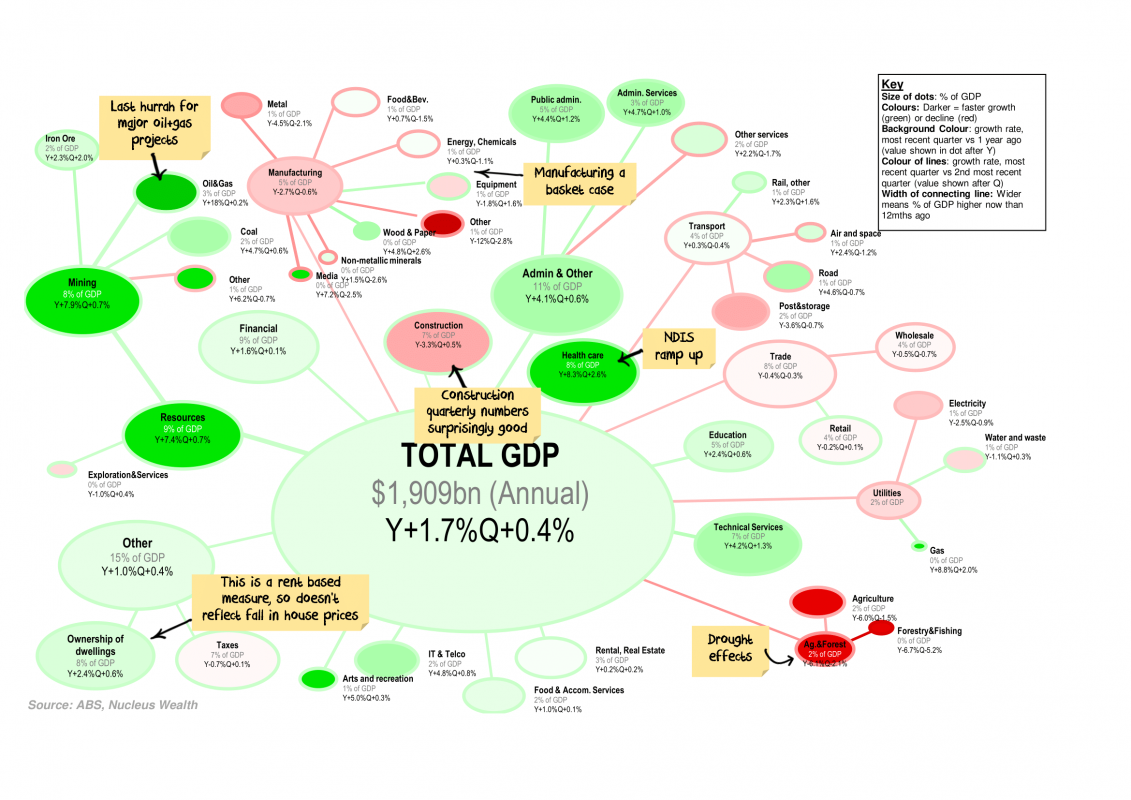
Every quarter I like to look at the changes in Australian GDP and which categories are responsible for the growth / decline. Each bubble represents a category of GDP proportionate to its size, colours represent the growth rate.
Click the charts for a large version and commentary:
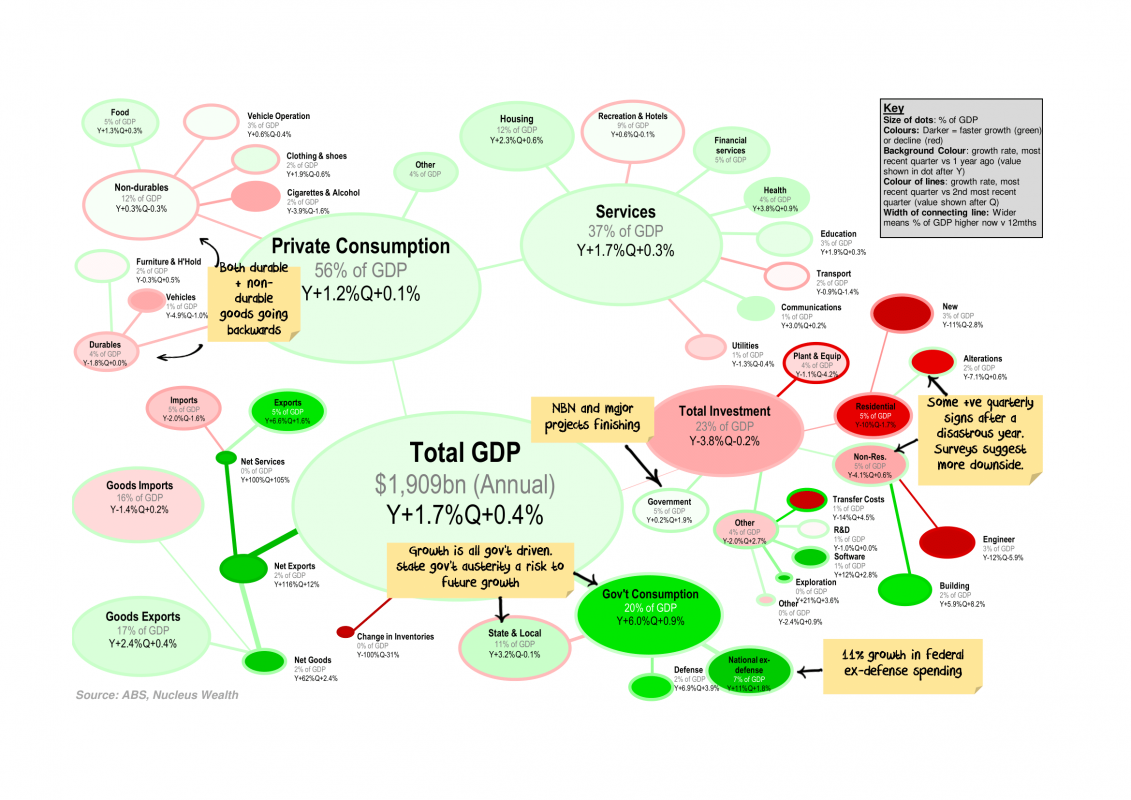
This quarter the key takeaways include:
- Federal Government spending (+11% for non-defence, 7% for defence over the year) the only thing keeping GDP above zero.
- Investment growth was not good, but I was expecting worse. Possibly there are green shoots, but capex surveys and investment forward indicators suggest there is still more downside.
- State & Local government spending has turned negative - with a low number of property transactions this is likely to remain a feature

Damien has a wealth of experience across international equities (Schroders), asset allocation (Wilson HTM) and he helped create one of Australia’s largest independent research firm, Aegis Equities. He lectured for over a decade at the Securities Institute, Finsia and Kaplan and spent many of those years as the external Chair for the subject of Industrial Equity Analysis. Damien runs the investment side of Nucleus Wealth, selecting stocks suggested by analysts and implementing the asset allocation. Damien started Nucleus Wealth after 20+ years in financial markets. He wanted to come up with an investment solution for ordinary investors that delivers the same types of personalised investment portfolios high net worth investors use.


