For many value investors, the Shiller Price/Earnings ratio is the holy grail. There are a number of problems with the ratio which are making it look way more expensive than it is. If we fix just some of the least contentious issues, the Shiller P/E looks almost 25% cheaper.
That (still) doesn't make the market cheap now. But it does explain why the Shiller P/E (also known as the Cyclically Adjusted Price Earnings or CAPE) has spent the last five years telling all and sundry that the S&P 500 was expensive throughout a marathon bull market.
I have two easily solvable criticisms of the measure:
There are other, more controversial changes, but more on them in a later post.
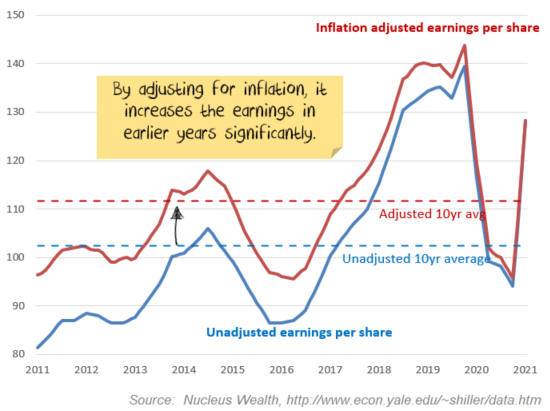
The idea of the Shiller P/E is to give us a longer-term look at actual earnings without being distorted by short term issues. Or relying on perennially optimistic analyst forecasts.
So, the Shiller P/E takes a ten year average of earnings. The trick is that earnings from ten years ago are not the same as earnings from today due to inflation. And so the measure adjusts to get the earnings in today's dollars:
Effectively, the Shiller P/E is saying ten years of inflation-adjusted earnings per share are a reasonable measure of the earnings power of the stock market.
To stay updated on the rest of this series and be notified of each part, sign up to receive email updates from us via the form below:
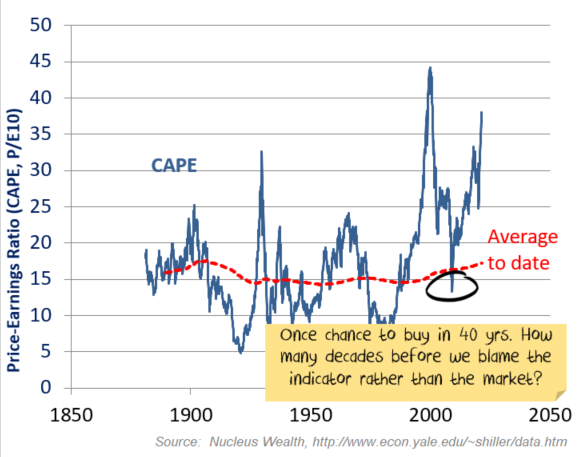
Backtests typically show the Shiller P/E does a good job of predicting long term returns, although it isn't a good timing tool.
But, the real problem with the Shiller P/E for a value investor is that it keeps saying: "don't buy now". And the S&P 500 keeps rising.
Say you are a value investor who only wanted to own stocks when the Shiller P/E was below its average. In the last forty years, you would have owned equities for seven months.
Rather than averaging real 10 year earnings per share, I'm suggesting:
A very subtle difference in definition. But a huge difference in outcomes.
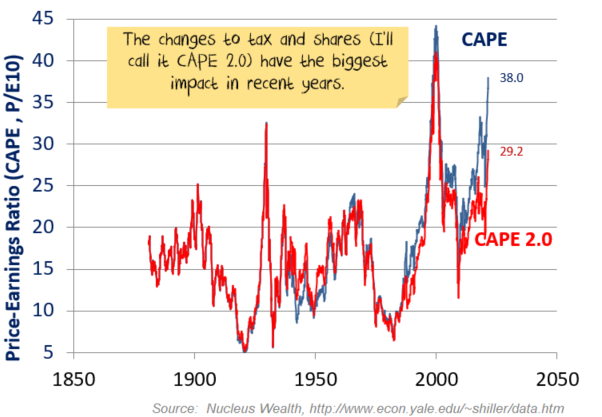
One problem with the Shiller P/E is taxes. If I look over the last ten years in the US, six of those years had a corporate tax rate of 35% and four have a tax rate of 21%. Effectively, the Shiller P/E is telling us the right tax rate to value a company is (35%x6+21%x4)/10=29.4%.
It doesn't add up. Today's investor does not expect a 29% tax rate, they expect a 21% tax rate.
It makes much more sense if we:
Buybacks were illegal in the US prior to 1982. The rise in buybacks (rather than dividends) in theory creates earnings per share growth by decreasing the number of shares.
Shiller acknowledges this and offers an alternative that re-invests dividends. I think he is trying to solve a different problem. So, I disagree with his methodology. At a minimum, this adjustment should make the S&P look cheaper because there are fewer shares now. His method makes the S&P look more expensive.
It makes much more sense if we:
* This is a bit of an oversimplification. Basically, we adjust for shares bought back. More on this in the next post.
The changes reduce the current Shiller P/E from 38x using the total return method to 29x. Still historically expensive, but 23% cheaper than the Shiller P/E currently suggests. And it gave the value investor many more chances to invest in recent years.
See ie_data_klassen_adjustments for Shiller's spreadsheet with my modifications.
There are some other, more contentious changes that bear consideration:
I'll cover off on these, plus more issues with tax in a second post. In the final post, I'll look at the Australian market.
To stay updated on the rest of this series and be notified of each part, sign up to receive email updates from us via the form below:
By doing the above, we generate some interesting stats on earnings.
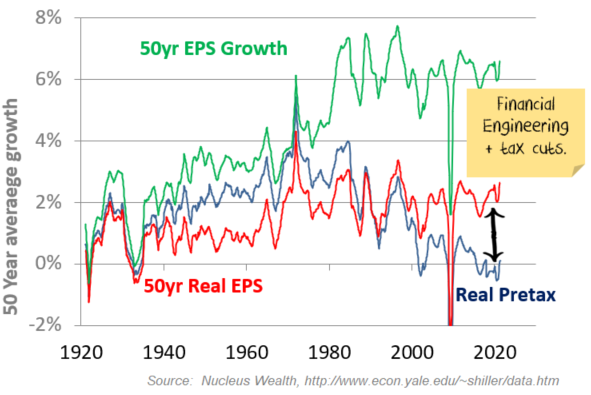
Nominal 50-year earnings growth on the S&P to date was 6.6% per annum. Plus an average 2.9% dividend yield gives us 9.5% before valuation changes. Which sounds good.
It is actually the opposite:
Stocks have had much better half-centuries. 2-3% growth was pretty common for most of the century prior to 1990:
The pessimist might build up up an earnings forecast: 0% pretax profit + 2% from buybacks + 2% from inflation means only 4% profit growth going forward. Half of which is financial engineering. And they would probably have a dig about how much worse the results would have been further without even more financial engineering in the form of increased debt, aided by falling interest rates.
The optimist might go the other way, it has been a rough 50 years for earnings, surely the next 50 will be better?
Damien Klassen is Head of Investments at Nucleus Wealth.
Follow @DamienKlassen on Twitter or Linked In
The information on this blog contains general information and does not take into account your personal objectives, financial situation or needs. Past performance is not an indication of future performance. Damien Klassen is an authorised representative of Nucleus Wealth Management, a Corporate Authorised Representative of Nucleus Advice Pty Ltd - AFSL 515796.